

Your analytics chatbot scores 82% on an eval. A new prompt scores 85% on the same questions. Before you ship it, you need to know whether that higher score reflects better answers. That means checking two things: whether you tested enough questions, and whether the answers were graded correctly.
Is the eval big enough? An eval doesn’t test a system on every question users will ask; it tests a sample. Pick a different 200 questions and you’d get a different score. The eval needs enough questions for a real improvement to stand out from that luck of the draw.
Is the grading right? Every answer has to be graded, and graders make mistakes. When I started building evals for an AI analytics chatbot, I saw this quickly. An answer key accepts only one reading of an ambiguous date range. Two human raters disagree on whether a revenue number should pass when it silently excludes refunds. An LLM judge accepts a confident explanation without noticing that the SQL double-counts orders.
It’s tempting to treat these as separate problems, but they aren’t. Grader mistakes change how many questions you need. An eval can be correctly sized to detect a 3-point change in the grader’s pass rate and still be badly sized to detect a 3-point change in answer quality. Anyone who has run A/B tests knows the principle: validate the metric before sizing the experiment. In an eval, the grader is the metric.
This piece starts with sizing an eval as if the grader were perfect, then adds grader mistakes: random ones, which raise the number of questions you need, and biased ones, which no number of questions fixes. It ends with how to audit a grader and a step-by-step recipe for sizing an eval.
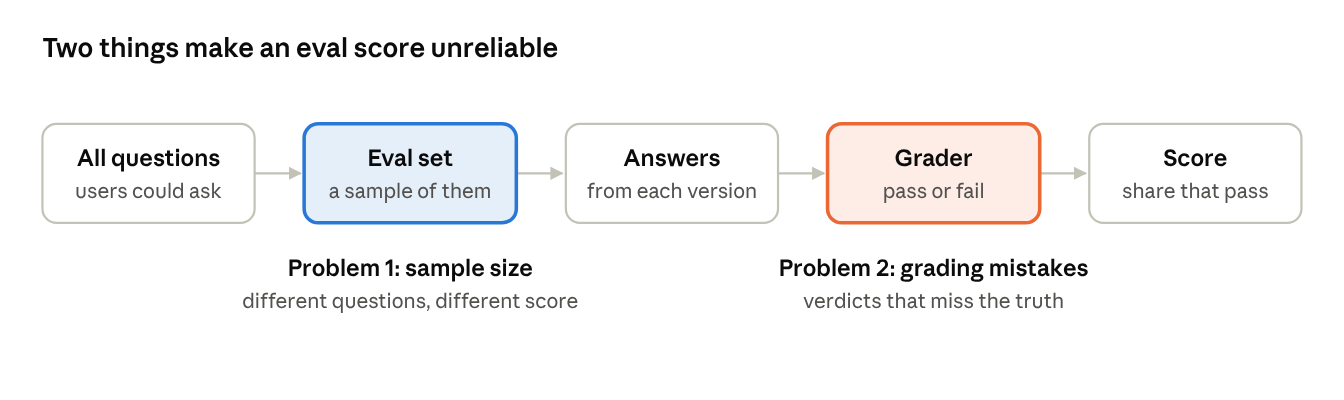
where an eval score’s noise comes from · 2 problems
How big does an eval need to be?
An eval here has three parts: a set of questions, an answer to every question from each version of the chatbot you’re comparing (such as the current prompt and the new one), and a grader that marks each answer pass or fail. A version’s score is the share of its answers that pass. All the numbers in this piece assume pass/fail grading. If you grade on a scale instead, such as 1 to 5, the same ideas apply: you still need enough questions, and grader mistakes still shrink the gap you can see. You’ll just need different formulas to get the numbers.
This section assumes a perfect grader. Take the opening example: the current prompt answers 82% of questions correctly, and the new one reaches 85%. How many questions do you need to separate a real 3-point gain from sampling variance, the score’s natural swing from one set of questions to another?
It’s the same calculation as sizing an A/B test. Pick the smallest improvement worth detecting, a significance level (5%, two-sided), and power, the chance of detecting the improvement if it’s real (80%).
In practice, both versions answer the same questions, a setup called a paired design. Their results are correlated: both tend to pass easy questions and fail hard ones. Comparing them question by question removes that shared difficulty from the noise. What matters then is how often the two versions disagree, one passing while the other fails.
Why disagreement? Questions that both versions pass, or both fail, say nothing about which is better, just as two students who both ace question 7 haven’t shown who’s stronger. Only the split questions carry information, and the measured gap is simply the new version’s wins minus the old version’s wins.
Take 100 shared questions and a true 3-point gain. If the versions disagree on 10 of them, the split might be 6.5 wins to 3.5. If they disagree on 20, it might be 11.5 to 8.5. The net is +3 either way, but each split question is like a coin flip that leans slightly toward the new version, and 20 flips swing around more than 10. More disagreement means more random back-and-forth around the same gain, so you need more questions before it stands out:

You’d need to estimate that disagreement rate too, ideally from an earlier comparison.
Most internal eval sets have 50 to 300 questions. With 100 shared questions, the smallest improvement you can reliably detect is around 9 to 12 points, depending on how often the versions disagree: against the current 82%, the new version would need to score roughly 91% to 94% before the eval could reliably tell them apart.
Pairing is what makes those numbers possible. If each version answered its own separate set of questions, the textbook A/B setup, you’d need about 2,400 questions per version for the same 3-point gain, roughly three times as many. With 100 questions per version, the smallest detectable improvement would grow to around 13 points, a score of about 95%.
Evan Miller’s Adding Error Bars to Evals develops paired analysis, power calculations, and clustered error bars for questions that come in related groups, such as several questions about the same table. His framework also allows for random variation within a single question, so ordinary error bars already absorb some random grading noise.
What error bars can’t tell you is whether the grader’s pass rate tracks actual correctness. That’s the second problem, and the rest of this piece is about it.
Every grader makes mistakes
First, make sure the task has a right answer. In analytics, many questions hinge on a definition nobody wrote down. “Last month” can mean the calendar month or the last 30 days. Revenue may include or exclude refunds. An active customer might be someone who bought, logged in, or did something else. If the definition is open, a mismatch with the answer key isn’t a grading mistake. The eval is mixing correctness with whether the chatbot guessed the key’s interpretation. Fix the task before judging the grader.
Golden sets. A golden set grades each answer by comparing it with a reference answer written in advance. The weak point is the reference itself: if it’s wrong, a correct answer fails, and a wrong answer that matches it passes. This happens even in well-known benchmarks: a 2021 study of ten widely used ML test sets found label errors averaging at least 3.3% (Northcutt et al.). That isn’t an error rate for analytics evals, but it’s a good reason to treat every answer key as a measurement that needs checking.
Human raters. People handle ambiguity better than an answer key, but they make judgment calls. Does the right number with one wrong sentence of explanation pass? Is an unstated assumption acceptable? Raters also change their standards as they go. Researchers studying LLM-assisted grading call this criteria drift: people refine what “good” means after seeing outputs (Shankar et al.). The refined rubric is often better, but answers graded before the change may need regrading.
LLM judges. A 2023 study of LLM judges found position, verbosity, and self-preference biases (Zheng et al.). For an analytics chatbot, the bigger question is whether the judge can check the calculation at all. A judge that sees only the final answer, without the query, data, or execution result, can’t establish correctness. Asking it again won’t supply evidence it never had.
Some of these mistakes hit both versions about equally. Others take sides. The next two sections take each in turn.
What random mistakes do to sample size
Start with a deliberately simple model. Assume the grader:
wrongly fails 10% of correct answers,
wrongly passes 10% of incorrect answers,
makes each mistake independently, and
behaves the same way for both versions.
That’s a stronger set of assumptions than “the grader is 90% accurate,” and it’s worth stating them, because the results depend on them.
Picture 100 questions. The current version truly gets 82 right and 18 wrong. The grader passes 90% of the 82 correct answers, about 74, and wrongly fails the rest. It also wrongly passes 10% of the 18 wrong answers, about 2. So it reports about 76 passes, 75.6% to be exact, instead of 82.
Do the same for the new version, which truly gets 85 right and 15 wrong. About 76.5 correct answers pass, and 1.5 wrong ones slip through, so the grader reports 78%. The true gap is 85 − 82 = 3 points. The gap the grader reports is 78 − 75.6 = 2.4 points.
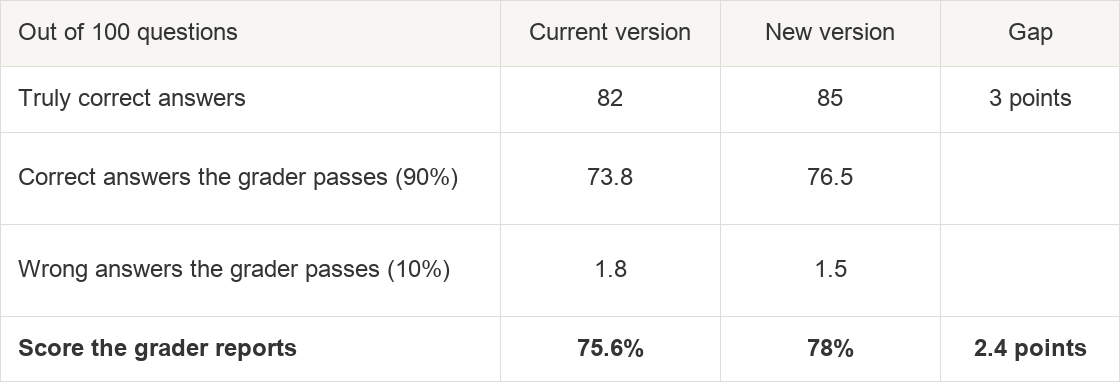
Why 2.4 and not 3? Follow one of the three questions the new version fixes. Before the fix, its answer was wrong, but the grader still passed it 10% of the time. After the fix, the answer is right, but the grader passes it only 90% of the time. So on average the fix moves that question from 0.1 passes to 0.9, a gain of 0.8, not a full 1. Three fixes add 3 × 0.8 = 2.4 points.
Written out, with true accuracy p, an answer passes either because it’s correct and the grader passes it, or because it’s wrong and the grader passes it anyway:
observed pass rate = 0.9 × p + 0.1 × (1 − p) = 0.1 + 0.8 × p
At p = 0.82 that gives 75.6%, and at p = 0.85 it gives 78%.
The general rule: the observed gap equals the true gap times J, where J = (share of correct answers the grader passes) + (share of incorrect answers it fails) − 1. Statisticians call this Youden’s J. Here J = 0.9 + 0.9 − 1 = 0.8. A perfect grader has J = 1; a coin flip has J = 0.

The required eval roughly doubles, for two reasons. The shrinking gap multiplies the questions needed by 1/J², here 1.56. And the grader pulls pass rates toward 50%, where scores are noisier, which adds roughly another 1.3× at an 82% baseline. Near a 50% baseline there’s no room for that second effect, so the increase is just the 1.56, about 56% more questions.
For planning, you don’t need a new formula. Use the standard sample-size calculation, but feed it the pass rates and gap the grader will actually report, not the true ones. Here that’s 75.6% vs. 78%. That’s how every number in this section was calculated.
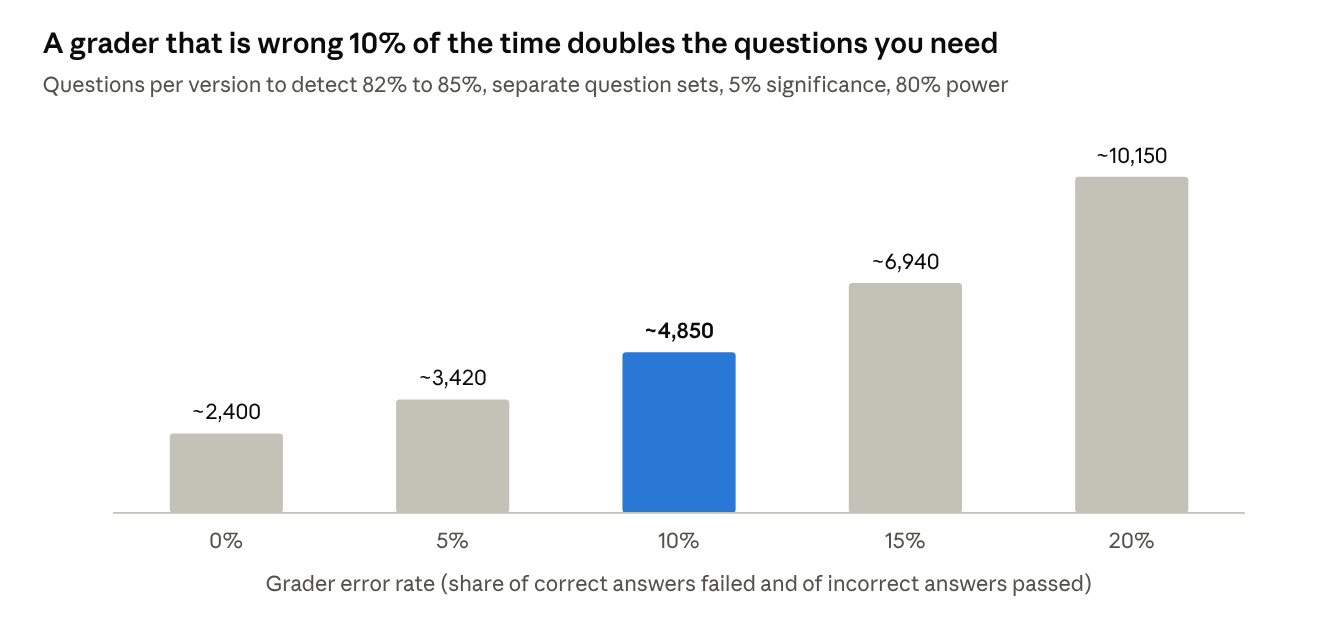
calculated for this article · normal approximation, symmetric independent grader errors
The cost accelerates: each extra 5 points of grader error adds more questions than the last.
Random grading mistakes reduce power. When they hit both versions equally, they shrink the gap on average, as 3 points became 2.4 above. That makes real improvements harder to detect. A finite eval can still report a false win; the significance level controls that risk. Calling grading error conservative here means it reduces power, not that a measured win is guaranteed to be real.
That holds only if the grader makes the same mistakes on both versions. Suppose the new prompt writes longer, more confident answers, and the grader is more easily fooled by long ones. It now wrongly passes 20% of the new version’s wrong answers but only 10% of the old version’s. If both versions are truly 82% correct, the grader reports 75.6% for the old version (0.9 × 82 + 0.1 × 18) and 77.4% for the new one (0.9 × 82 + 0.2 × 18). That’s a 1.8-point gain that doesn’t exist. Mistakes that favor one version are called systematic error, and the next section covers them.
The paired design is where these assumptions matter most. In a paired eval, only the questions where the versions disagree carry information. The model above assumes the grader’s mistakes are independent: a mistake on version A’s answer to a question says nothing about whether it makes one on version B’s answer to the same question. So take a question both versions truly got right. The grader might wrongly fail A’s answer and correctly pass B’s, and the question now looks like a disagreement. It’s a fake one, pure noise. If the versions truly disagree on 10% of questions, these fake disagreements push the observed rate to 24.4%, and the shared questions needed rise from about 870 to about 3,320. Treat that as close to a worst case.
Many grader mistakes aren’t independent across versions. A wrong answer key fails both versions’ identical correct answers together, so it creates no fake disagreement. An LLM judge that struggles with an ambiguous definition or a hard join tends to struggle on both versions’ answers to that question. Correlated mistakes partly cancel in a paired design, so the real cost usually sits between about 1,100 and 3,320. It doesn’t fall back to 870 even when mistakes are fully shared, because the grader still reports a 2.4-point gap, not 3.
Grader noise hurts the better design most. With separate question sets, 10% random flips roughly double the questions needed, from 2,400 to 4,850. With shared questions they nearly quadruple them, from 870 to 3,320. Pairing earns its advantage from low disagreement, and independent flips manufacture disagreement. Pairing still needs fewer questions, but its edge shrinks from about 2.8× to about 1.5×. That makes independent grading noise, such as an LLM judge giving different verdicts when rerun, more expensive in a paired eval than anywhere else.
So a single accuracy figure isn’t enough to plan with. You need the grader’s error rates on correct and incorrect answers separately, and whether its mistakes on the two versions of a question go together.
When mistakes take sides
The model above treats both versions the same. Real graders often don’t. Their mistakes can follow an answer style, a task type, or one version.
Suppose the new version writes longer explanations, and the judge rewards length even when the extra material is wrong. The measured advantage now exceeds the real improvement in correctness. A different bias could hide a real improvement or reverse the ranking.
More questions don’t fix this. They give you an increasingly precise estimate of the grader’s preference. In A/B terms, it’s a broken metric: no sample size rescues a test that’s measuring the wrong thing. You need evidence about the grading itself.
Grading your grader
That evidence comes from a grading audit, the eval equivalent of reconciling a metric against known transactions.
Take a random sample of answers from both versions. For each one, keep everything needed to check it: the question, the metric definitions, the query, a data snapshot, and the execution result. Have two reviewers grade independently against a versioned rubric. Compare their verdicts with the answer key and the LLM judge, then settle disagreements by going back to the underlying evidence.
Record more than an agreement percentage. Count three things separately: correct answers marked wrong, incorrect answers marked right, and cases that are still ambiguous or can’t be verified. Then check where the errors fall. If they concentrate in one task type or favor one version, you have bias, not noise.
The audit has its own sample-size problem. To estimate how often the grader passes incorrect answers, you need incorrect answers, and at an 82% baseline only about 1 in 5 answers is incorrect. A 200-answer audit gives you roughly 36. If the grader passes about 4 of them, roughly 10%, an exact 95% interval on that rate runs from about 3% to 26%. The other rate is estimated too: about 16 wrongly failed out of 164 correct answers gives roughly 6% to 15%. Together they leave J anywhere from about 0.65 to 0.87, and the questions you need could differ by about 2×. The fix is to stratify: sample more heavily where wrong answers are likely, such as answers the grader failed, questions where the versions disagree, and the hardest task types, then weight the results back to the full set.
The audit also shows where to cut errors at the source:
Golden sets: state the definition in the question, or accept every defensible answer.
Human raters: sharpen the rubric on the cases where they disagree, and regrade after it changes.
LLM judges: don’t ask the judge to verify what it can’t see. For an analytics chatbot, run the query and compare the result with the correct number in code, and use the judge only for what code can’t check, such as whether the explanation is clear.
One caution: two reviewers can share the same wrong assumption. The audit corrects toward your most careful grading, not toward perfect truth, and it’s worth saying so when you report results.
The sizing recipe
Putting it together, sizing an eval looks like this:
Define the tasks so each question has a right answer.
Audit the grader to estimate how often it fails correct answers and passes incorrect ones, and whether its mistakes favor either version.
Choose the design. Run both versions on the same questions where you can.
State the smallest improvement worth detecting in correctness, not in the grader’s pass rate.
Compute the questions needed with the standard formula, using the pass rates and gap the grader will actually report, not the true ones.
If the audit found bias, fix the grader or correct the estimate before trusting the result.
Try it on your eval
To run steps 4 and 5 for your own eval, I built a calculator. Enter your current and target accuracy, your grader’s two error rates from the audit, whether both versions answer the same questions, and for shared questions, how often the versions disagree and how much the grader’s mistakes on the two answers go together. It shows how many questions you need with a perfect grader and with yours, the gap your grader will actually report, and the smallest improvement your current eval set can detect.
For step 6, the simplest correction uses the audit’s two error rates directly:
True accuracy ≈ (observed pass rate + share of incorrect answers the grader fails − 1) / J
At a 75.6% observed rate that gives back 82%: (0.756 + 0.9 − 1) / 0.8. Epidemiologists call this the Rogan–Gladen estimator. It fixes the estimate but not the power: dividing by J also multiplies the standard error by 1/J, so the corrected gap is no easier to detect than the shrunken one. It also assumes the error rates are the same for both versions.
A more flexible option is Prediction-Powered Inference. It combines a large sample graded by the LLM judge with a smaller random sample graded carefully by people. For a mean score, the idea is simple:
Corrected estimate = the judge’s average on the large sample + the average (careful grade − judge grade) on the small sample.
The small sample measures the judge’s average error, and the confidence interval accounts for the uncertainty in that correction. For a comparison between two versions, apply the correction to the difference, not to each score separately.
It has limits. It corrects the overall estimate, not individual verdicts. The calibration sample has to be drawn at random from the same questions, not picked from conspicuous disagreements. With a weak judge, plain PPI can do worse than ignoring the judge and using the careful sample alone. Use the power-tuned version, PPI++, which decides from the data how much to trust the judge and is essentially never worse than either approach. A small calibration sample still leaves wide intervals. And everything above assumes you know the grader’s error rates, when in practice you’ve estimated them from an audit, so that uncertainty belongs in the final analysis too.
If you can’t get that many questions
Most teams have 150 carefully checked questions, not 3,000. That’s not a reason to stop, but it changes what the eval can claim.
Report what your eval can detect. Compute the smallest improvement your eval set and grader can reliably detect, and put it next to every result. “No significant difference” means something different when the eval can only see 15-point gaps.
Resample answers. Miller suggests generating several answers per question and averaging them, which cuts the noise from the model’s own randomness. It doesn’t add questions, so it helps less when question difficulty dominates.
Pair, and grade carefully where versions disagree. In a paired design, only questions where the versions differ carry information. Spend your careful human grading there.
Test sequentially. Add questions in batches and stop when the result is clear, using a method built for repeated looks, such as a group-sequential design or an always-valid test like mSPRT, so checking early doesn’t inflate false positives.
Treat small evals as regression checks. A 150-question eval is good at catching large breakages, not at proving a 3-point improvement. Use it to block bad changes, and confirm small wins another way, such as an online test.
Before trusting the number
Two bigger threats sit outside this piece. One is representativeness: eval sets are usually curated, not random samples of real questions, so the population behind the error bars is partly hypothetical. The other is iteration: test twenty prompt variants against the same 200 questions and the winner will look better than it is, the eval version of peeking. Even a well-sized eval with a validated grader can mislead if either goes unchecked.
The useful sizing question isn’t “how many questions does an eval need?” It’s “how many questions do I need to detect this improvement in correctness, with this grader, this design, and these dependencies between questions?”
Before I trust that number, I want to look at an answer the grader passed when it shouldn’t have, understand why, and check whether the same mistake would hit both versions equally. In an A/B test, that’s validating the metric before sizing the experiment. In an eval, the grader is the metric.