
The Cornerstones of Product Analytics
A Journey through Fundamental Principles and Strategies

As Geoffrey Moore once said, 'Without data, you are blind and deaf and in the middle of a freeway.' This quote perfectly captures my belief in the importance of data and analytics in today's business world.
Hello, I'm Piyush, and welcome to Inferentia - a platform where I share my insights and learnings on analytics in the e-commerce and fintech space. My focus is on various analytics verticals such as product, marketing, and growth analytics, and how they can transform businesses and drive growth.

In this first series of blog posts, we'll take a deep dive into The Cornerstones of Product Analytics, exploring the fundamental principles and strategies that underpin this essential discipline. Through this series, I will be taking you on a journey through the fascinating world of product analytics and showcasing how it has the power to transform businesses and drive growth. As someone who's worked extensively on product analytics, I've seen firsthand how it can be a game changer for organisations. From optimising product features to improving user experience, analytics plays a critical role in shaping business strategies. So join me on this exciting journey as we explore the world of product analytics together, and discover how data-driven insights can help you make smarter decisions and achieve better outcomes.
So what exactly is product analytics? At its core, it's the practice of collecting, analysing, and interpreting data to gain insights into how users interact with a product or service. For instance, product analytics can be used to understand how users interact with a website or mobile app, and identify areas for improvement. Let's say a company has an e-commerce website, and they notice that a large number of users abandon their shopping cart at the payment stage. Through product analytics, they can analyse user behaviour and identify the specific step that is causing the most drop-offs. This could be due to a complicated checkout process, lack of payment options, or other issues. With this information, the company can make targeted changes to improve the user experience and increase conversion rates.
Product analytics encompasses a wide range of techniques and methodologies that can be used to understand user behaviour, measure product performance, and identify areas for improvement. This involves a range of different components, including user engagement metrics, funnel analysis, cohort analysis, A/B testing, and predictive modeling, to name just a few. Each of these components plays a critical role in helping you gain insights into user behaviour, measure the impact of changes you make to your product, and ultimately drive growth for your business. Let's explore some of these areas in more detail:
Firstly, user engagement metrics are used to measure how users interact with a product or service. These metrics include things like time on site, click-through rates, and bounce rates. For example, if an e-commerce company notices a high bounce rate on their homepage, they may investigate and optimise the page to improve user engagement.
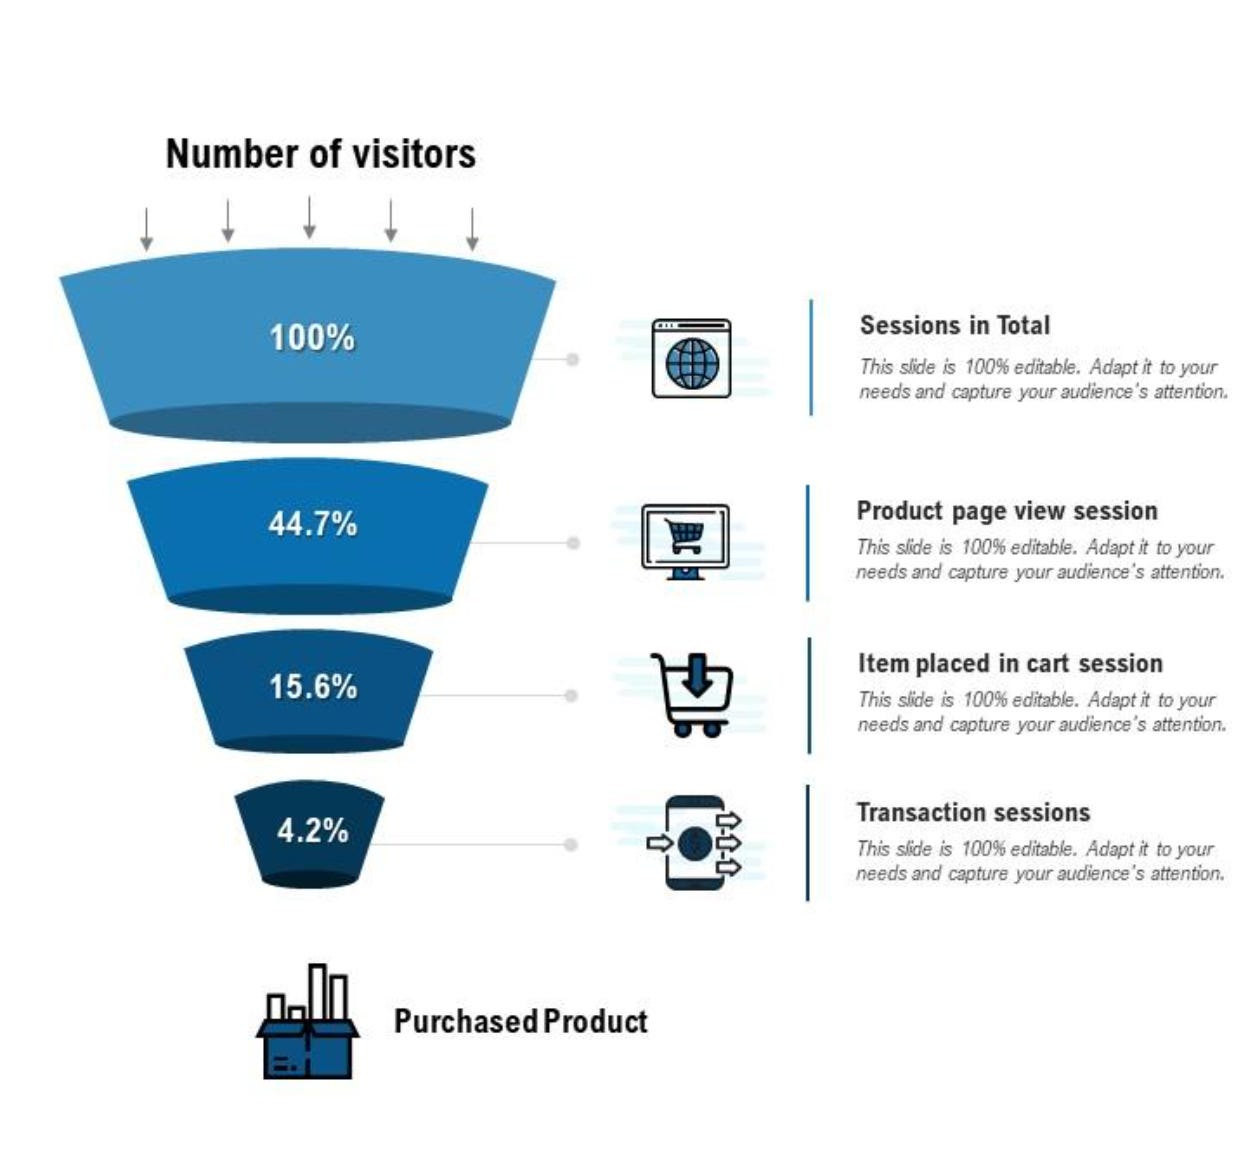
Funnel analysis is another important area of product analytics, where companies analyse the steps users take to complete a particular action or goal. This helps identify areas of the funnel that need improvement or optimisation. For instance, an online retailer may analyse their checkout funnel to understand why users are dropping off at certain steps and take steps to simplify the process.
Cohort analysis involves grouping users based on a common attribute, such as the month they signed up or the region they're from. By comparing the behaviour of different cohorts over time, companies can identify trends and make data-driven decisions. For example, a mobile app company may compare the retention rates of users who signed up in January versus those who signed up in February to understand how their product is performing. A/B testing is a method of comparing two versions of a product or feature to determine which performs better. For example, an email marketing campaign might test two subject lines to see which one results in a higher open rate.
Finally, predictive modeling uses historical data to make predictions about future outcomes. This can be used to inform decisions around everything from pricing to inventory management. For example, an online retailer may use predictive modeling to forecast demand for a particular product and adjust inventory levels accordingly.
In the upcoming posts, we will dive deep into each of these areas of product analytics, examining their core concepts, techniques, and best practices. We'll explore user engagement metrics, such as session duration, bounce rate, and retention rate, and discuss how they can help us understand user behavior and optimize product features. We'll also cover funnel analysis, which involves tracking user behavior as they move through various stages of the product journey and identifying key drop-off points. Cohort analysis, which allows us to group users based on common characteristics and track their behaviour over time, will also be explored in detail.
Furthermore, we will delve into A/B testing, a critical tool for testing product features, messaging, and pricing strategies. Predictive modeling, which involves using statistical algorithms to forecast future user behaviour, will also be a key area of focus.
We've only just scratched the surface of what product analytics has to offer. Over the course of this series, we'll take a deep dive into each of these areas, exploring best practices, case studies, and real-world examples to help you apply these concepts. And, of course, we'll cover much more than just the areas we've discussed today – from user engagement metrics to predictive modeling and beyond. So, if you want to stay up-to-date with the latest insights and strategies for leveraging data to drive growth, be sure to subscribe to our blog and join us on this exciting journey through the world of product analytics!